If you’ve ever used WireMock for integration testing, you know it’s an incredibly powerful tool. However, you’ve probably also noticed that its default logging, while informative for humans, can be a real headache for machines. It’s verbose, multi-line, and unstructured, making it a challenge to parse and analyze in a modern log aggregation system.
In this post, we’ll walk through a custom WireMock extension that transforms this noisy output into clean, single-line, structured JSON logs, perfect for systems like Logstash, Fluentd, or an OpenSearch/ELK stack.
The Problem: Default WireMock Logging
When WireMock serves a request, it logs a detailed, human-readable summary to the console. It looks something like this:
2025-11-06 20:00:00.123 ===============================================================================
| Request received:                                                              |
|   GET /api/users/123                                                           |
|   Accept: [application/json]                                                   |
|                                                                                |
| Matched response definition:                                                   |
|   HTTP/1.1 200                                                                 |
|   Content-Type: [application/json]                                             |
|                                                                                |
| Response:                                                                      |
|   HTTP/1.1 200                                                                 |
|   Content-Type: application/json                                               |
|   Body: {"id": 123, "name": "John Doe"}                                        |
================================================================================
While great for debugging during development, this format is a nightmare for automated parsing:
- Multi-line: A single event is spread across many lines.
- Unstructured: It’s free-form text, not a key-value format.
- Inefficient: Requires complex grok patterns or custom scripts in your log aggregator to even begin to make sense of it.
The Solution: A Custom ServeEventListener
WireMock provides a powerful extension mechanism, and the ServeEventListener interface is the perfect hook for our needs. It allows us to execute custom code just before a response is sent, giving us access to the complete request and response objects.
We’ll create an extension that:
- Hooks into the
beforeResponseSentevent. - Gathers all relevant data from the request and response.
- Constructs a JSON object with this data.
- Prints the JSON object to the console as a single line.
Key Features of the Extension
This isn’t just a simple JSON converter. It includes intelligent sanitization to keep your logs clean and efficient.
1. Structured, Single-Line JSON Output
Every request-response pair is logged as one line, making it trivial for log shippers to pick up.
2. Intelligent Sanitization of Binary Data
Logging raw binary content is a recipe for disaster. It corrupts JSON, bloats logs, and provides no searchable value. Our extension automatically handles this:
- Binary Request Bodies: For requests like file uploads (
multipart/form-data,application/pdf, etc.), the entire body is replaced with a simple placeholder:"<binary content not logged>". - Large Base64 Fields: For API responses that include file downloads as Base64 strings, the extension recursively scans the JSON response. If it finds a long string that is valid Base64, it replaces it with
"<base64_data_omitted>". This prevents multi-megabyte log entries while still indicating that binary data was present.
Example of the Final Log Output
Here’s what a log entry for a file download looks like with our extension. Notice how the request and response bodies are cleanly handled.
{
  "@timestamp": "2025-11-06T18:19:36.046Z",
  "service": "wiremock",
  "wasMatched": true,
  "requestId": "af7dc0f1-81dd-4ab1-9635-3bd44b4414bf",
  "request": {
    "method": "POST",
    "url": "http://localhost:9119/auxi/downloadSign",
    "clientIp": "127.0.0.1",
    "headers": { "Content-Type": "application/json; charset=UTF-8" },
    "body": "{ \"idPF\": \"vbak1ds48m\"}"
  },
  "response": {
    "status": 200,
    "headers": { "Content-Type": "application/json;charset=UTF-8" },
    "body": "{\"documentoFirmadoBase64\":\"<base64_data_omitted>\"}"
  }
}
How to Use It
1. Get the Code
Clone the repository from GitHub.
git clone https://github.com/bernalvarela/wiremock-log-extension.git
cd wiremock-log-extension
2. Build the Extension
The project uses Maven. Build the self-contained “uber-JAR” with one command:
mvn clean package
This will compile the code, run the tests, and create wiremock-log-extension-1.0.0-SNAPSHOT.jar in the target/ directory.
3. Run WireMock with the Extension
- Copy the generated JAR into your WireMock
extensionsdirectory. - Start WireMock using the
--extensionsflag to point to the main class of our listener.
java -jar wiremock-standalone.jar --extensions dev.bernalvarela.wiremock.extensions.StructuredJsonLoggingListener
That’s it! WireMock will now output structured JSON logs to the console for every request it serves.
Bonus: Integrating with Docker and Logstash
This extension truly shines when combined with a log aggregation pipeline. Here’s a sample configuration for sending logs from a Dockerized WireMock to Logstash.
docker-compose.yml for WireMock:
We use the syslog logging driver to forward all console output to Logstash.
version: "3.9"
services:
  wiremock:
    image: wiremock/wiremock:3.13.1
    container_name: wiremock
    # ... volumes and other config ...
    logging:
      driver: "syslog"
      options:
        syslog-address: "tcp://localhost:12201"
        tag: "wiremock-log"
logstash.conf Pipeline:
This Logstash pipeline listens for the syslog stream, reassembles any large logs that were split into multiple lines, and then parses the resulting JSON.
input {
    tcp {
        port => 12201 # We keep the same port
        # We use the multiline codec to reassemble the chunks
        codec => multiline {
            # The pattern that defines the START of a new message.
            # Your JSON always starts with `{"@timestamp":`.
            pattern => "^\<[0-9]{1,3}\>.*\{\"@timestamp\""
            # If a line does NOT start with that pattern...
            negate => true
            # ... then it belongs to the previous line.
            what => "previous"
            # Wait 2 seconds before sending a message if no more lines arrive.
            auto_flush_interval => 2
        }
        # We add a tag to identify these logs in the filter.
        tags => ["wiremock_multiline_stream"]
    }
}

filter {
    # Process events tagged by the TCP input.
    if "wiremock_multiline_stream" in [tags] {

        # Drop any messages that are not the JSON logs from our extension (e.g., WireMock startup lines).
        # Valid logs are identified by the presence of '{"@timestamp"'.
        if [message] !~ /\{\"@timestamp\"/ {
            drop {}
        }

        # Extract the JSON payload from the full syslog message.
        grok {
            # Match everything from the first '{' to the end of the string.
            match => { "message" => "(?<json_content>\{[\s\S]*)" }
        }

        # If the JSON payload was successfully extracted.
        if [json_content] {
            # Sanitize the extracted content by removing any newline characters.
            mutate {
                gsub => [ "json_content", "\n", "" ]
            }

            # Parse the sanitized string as JSON, populating the event with its fields.
            json {
                source => "json_content"
            }

            # Rename the original 'host' field for clarity.
            mutate {
                rename => { "host" => "source_host_details" }
            }

            mutate {
                # Define a dynamic target index for OpenSearch/Elasticsearch.
                add_field => { "[@metadata][target_index]" => "wiremock-logs-%{+YYYY.MM.dd}" }
                # Remove temporary and redundant fields for a cleaner final document.
                remove_field => ["[event][original]", "json_content", "message", "tags"]
            }
        } else {
            # If Grok fails, tag the event for easier debugging.
            mutate {
               add_tag => ["_grok_json_extract_failure"]
            }
        }
    } else {
        # Route any other logs to a separate error index for review.
        mutate {
            add_field => { "[@metadata][target_index]" => "wiremock-errors-logs-%{+YYYY.MM.dd}" }
        }
    }
}

output {
    opensearch {
        # ... your opensearch config ...
    }
}
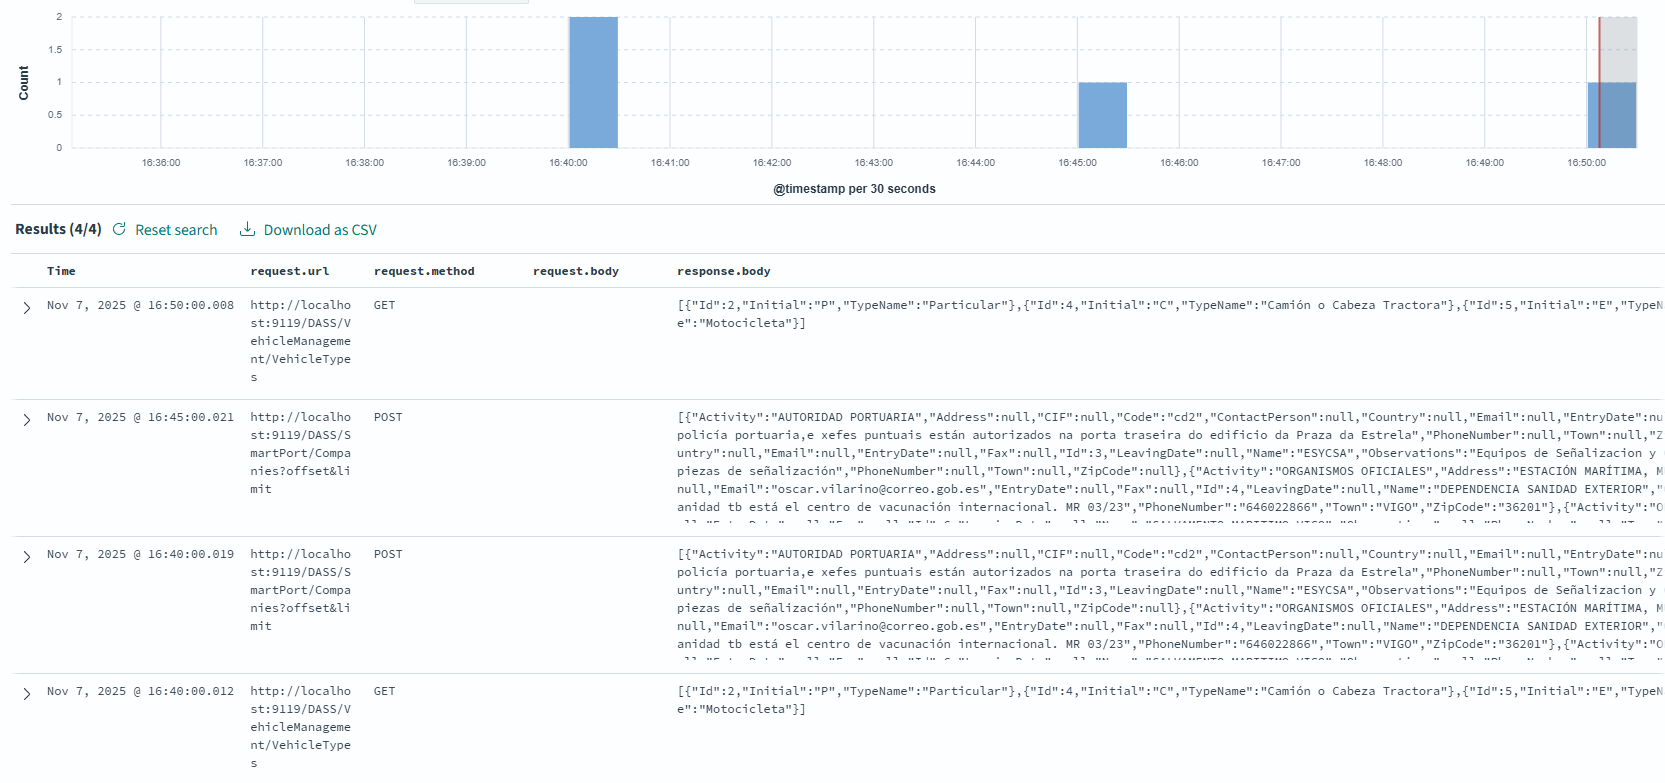
The Final Result in OpenSearch
After setting up the entire pipeline, the logs are parsed, enriched, and stored in OpenSearch. The result is a collection of structured, easily searchable documents. You can use OpenSearch Dashboards to explore the data, create visualizations, and build monitoring dashboards.
Here is an example of how the final log looks in OpenSearch Dashboards:
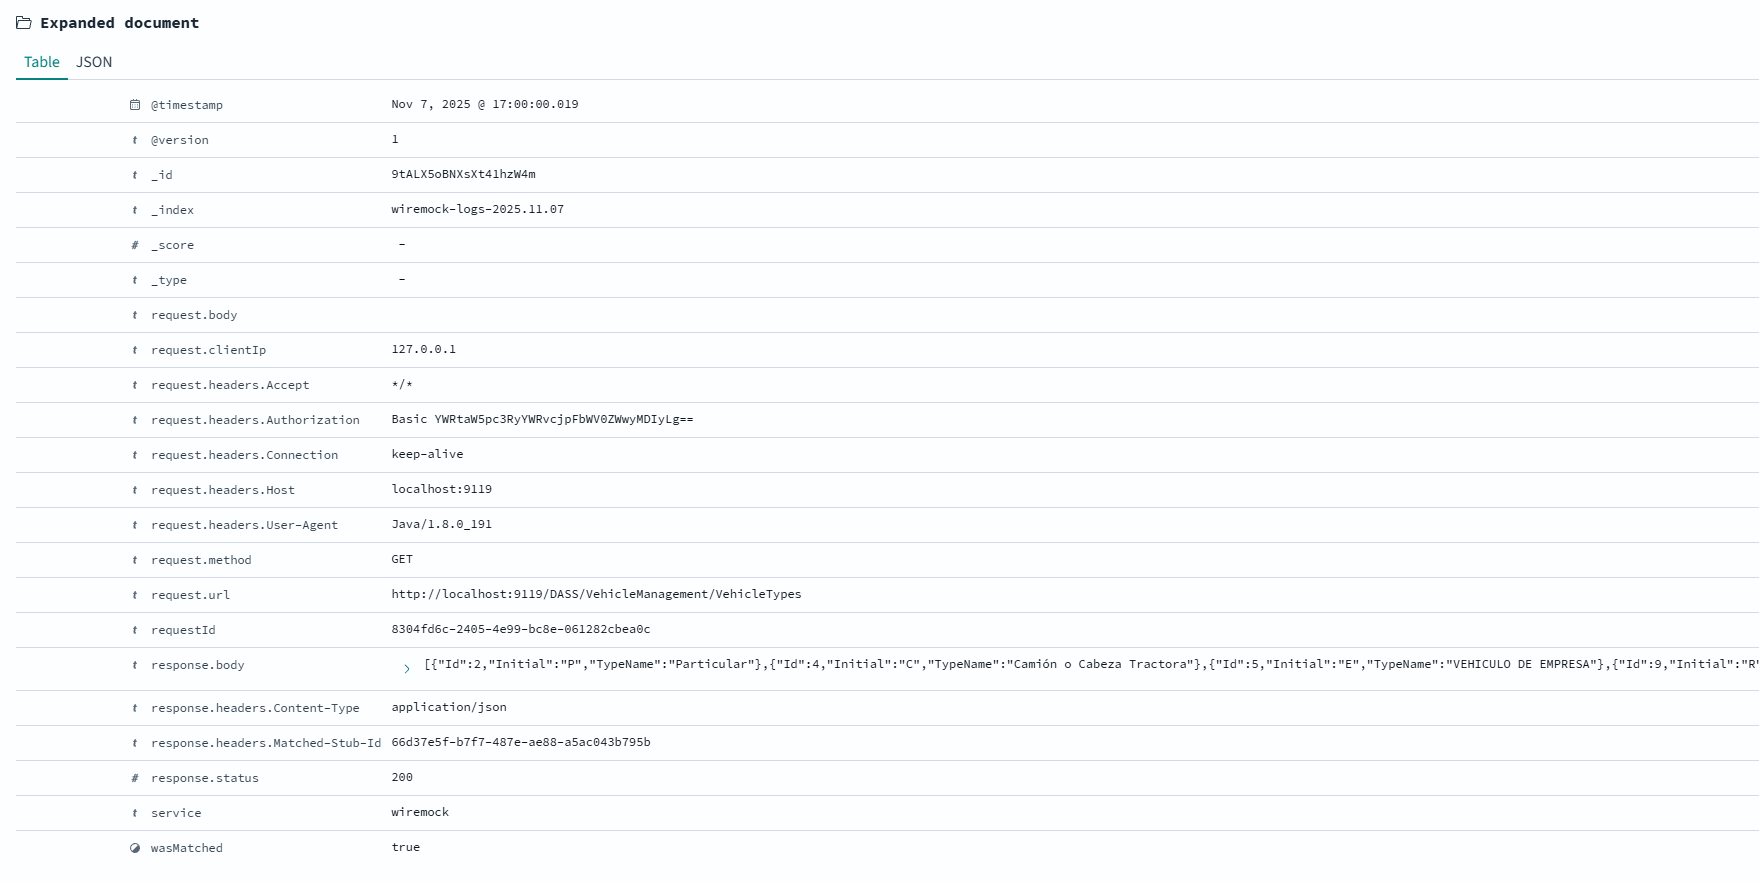
In contrast, when the response is a standard JSON object, the entire body is logged, providing full visibility into the data being exchanged.
Here is a view of a log containing a full JSON document as seen in OpenSearch:
Conclusion
With a simple Java extension, we’ve transformed WireMock’s logging from a developer-focused convenience into a powerful, production-ready data source for observability. This approach makes it incredibly easy to monitor, alert on, and analyze your test traffic, bridging the gap between integration testing and production monitoring.
You can find the complete source code, including the Maven project and unit tests, on GitHub.